Monitoring postfix with Zabbix (LTS version 3.0)
As we’ve built new monitoring system based on Zabbix LTS version 3.0 I also was looking for solution how to monitor postfix servers. I’ve found few articles regarding this issue but they were either outdated or not very effective.
I decided to take the best from what I’ve found but build an own strategy.
The whole solution consists of several different parts:
- pygtail softwareThis one reads the lines of mail log (this tools is written in Python and works great on Centos 6 and Centos 7. It doesn’t run on Centos 5 due to older Python libraries. You can download my spec file for Centos 6/7 here if you want to create an RPM package,
- pflogsumm scriptThis script is part of postfix-perl-scripts package on Centos 6 and 7 and can read the Postfix logs and create nice summary. We’d use this one to get the summary and parse it for interesting values to be further read by Zabbix
- Zabbix temlate for Postfix monitoring
- create userparameter_postfix.conf file under /etc/zabbix/zabbix_agent.d with this content (you also have to enable remote commands to be run on Zabbix clients by adding enableEnableRemoteCommands=1 to main config file /etc/zabbix/zabbix_agentd.conf):# Postfix user parameter UserParameter=postfix.pfmailq,mailq | grep -v “Mail queue is empty” | grep -c '^[0-9A-Z]' UserParameter=postfix[*],sudo /usr/local/bin/zabbix-postfix-stats.sh $1 UserParameter=postfix.update_data,sudo /usr/local/bin/zabbix-postfix-stats.sh
- we need to add this line to /etc/sudoers to grant zabbix user access to run the main script with root permissions (otherwise zabbix user would need access to read mail logs):zabbix ALL=NOPASSWD: /usr/local/bin/zabbix-postfix-stats.sh *
- simple bash script which uses pygtail and pflogsumm and gets the interesting data from Postfix log to by further read by Zabbix:#!/usr/bin/env bash MAILLOG=/var/log/maillog PFOFFSETFILE=/tmp/zabbix-postfix-offset.dat PFSTATSFILE=/tmp/postfix_statsfile.dat TEMPFILE=$(mktemp) PFLOGSUMM=/usr/sbin/pflogsumm PYGTAIL=/usr/bin/pygtail # list of values we are interested in PFVALS=( 'received' 'delivered' 'forwarded' 'deferred' 'bounced' 'rejected' 'held' 'discarded' 'reject_warnings' 'bytes_received' 'bytes_delivered' ) # write result of running this script write_result () { echo “$2” exit $1 } # check for binaries we need to run the script if [ ! -x ${PFLOGSUMM} ] ; then echo “ERROR: ${PFLOGSUMM} not found” exit 1 fi if [ ! -x ${PYGTAIL} ] ; then echo “ERROR: ${PYGTAIL} not found” exit 1 fi if [ ! -r ${MAILLOG} ] ; then echo “ERROR: ${MAILLOG} not readable” exit 1 fi # check whether file exists and the write permissions are granted if [ ! -w “${PFSTATSFILE}” ]; then touch “${PFSTATSFILE}” && chown zabbix:zabbix “${PFSTATSFILE}” > /dev/null 2>&1 if [ ! $? -eq 0 ]; then result_text=”ERROR: wrong exit code returned while creating file ${PFSTATSFILE} and setting its owner to zaabbix:zabbix” result_code=”1″ write_result “${result_code}” “${result_text}” fi fi # read specific value from data file and print it readvalue () { local $key key=$(echo ${PFVALS[@]} | grep -wo $1) if [ -n “${key}” ]; then value=$(grep -e “^${key};” “${PFSTATSFILE}” | cut -d “;” -f2) echo “${value}” else rm “${TEMPFILE}” result_text=”ERROR: could not get value “$1″ from ${PFSTATSFILE}” result_code=”1″ write_result “${result_code}” “${result_text}” fi } # update value in data file updatevalue() { local $key local $pfkey key=$1 pfkey=$(echo “$1” | tr '_' ' ') # convert value to bytes value=$(grep -m 1 “$pfkey” $TEMPFILE | awk '{print $1}' | awk '/k|m/{p = /k/?1:2}{printf “%d
“, int($1) * 1024 ^ p}') # update values in data file old_value=$(grep -e “^${key};” “${PFSTATSFILE}” | cut -d “;” -f2) if [ -n “${old_value}” ]; then sed -i -e “s/^${key};${old_value}/${key};$((${old_value}+${value}))/” “${PFSTATSFILE}” else echo “${key};${value}” >> “${PFSTATSFILE}” fi } # is there a requests for specific value or do we update all values ? if [ -n “$1” ]; then readvalue “$1” else # read the new part of mail log and read it with pflogsumm to get the summary “${PYGTAIL}” -o”${PFOFFSETFILE}” “${MAILLOG}” | “${PFLOGSUMM}” -h 0 -u 0 –no_bounce_detail –no_deferral_detail –no_reject_detail –no_smtpd_warnings –no_no_msg_size > “${TEMPFILE}” 2>/dev/null if [ ! $? -eq 0 ]; then result_text=”ERROR: wrong exit code returned while running “${PYGTAIL}” -o”${PFOFFSETFILE}” “${MAILLOG}” | “${PFLOGSUMM}” -h 0 -u 0 –no_bounce_detail –no_deferral_detail –no_reject_detail –no_smtpd_warnings –no_no_msg_size > “${TEMPFILE}” 2>/dev/null” result_code=”1″ write_result “${result_code}” “${result_text}” fi # update all values from pflogsumm summary for i in “${PFVALS[@]}”; do updatevalue “$i” done result_text=”OK: statistics updated” result_code=”0″ write_result “${result_code}” “${result_text}” fi rm “${TEMPFILE}”
This is a summary how the whole thing works:
- All items from Zabbix postfix template refer to user parameters defined in userparameter_postfix.conf file. These are read on zabbix client and triggers the launch of the defined bash script zabbix-postfix-stats.sh
- There is a item called ‘Postfix data update request’ in the template which is run every minute. This one calls the script zabbix-postfix-stats.sh without any arguments which makes the script to update all the statistics from the Postfix mail log file. To parse the log file we need both pygtail and pflogsumm tools – both mentioned at the beginning.
- The rest of template items are not run so often and causes the script zabbix-postfix-stats.sh to be run with a specific argument depending on item type. If the postfix statistics were already made the value which is requested by each item is returned.
Posted in Monitoring
Источник: http://admin.shamot.cz/?p=424
Spamlists monitoring in Zabbix
Most companies have a wide variety of services running, usually with public and private facing interfaces.
If you are providing services like SMTP, DNS or similar to your customers, those services might be misused and you could end up getting your servers IP addresses blacklisted on various Domain Name System Blackhole Lists (DNSBL).
This could hurt your reputation as a service provider and will certainly result in a bad experience for your customers.
You can check DNSBL manually but it’s better to do with Zabbix!
You will need to install DNS utility on your system:
CentOS/RedHat/Fedora
# yum install bind-utils
Debian/Ubuntu
# apt-get install dnsutils
How Zabbix monitors DNSBL
This template utilizes External Checks. The script “check_dnsbl.sh” is run with parameters for the hostname of the server you wish to check and which DNSBL you wish to check against. It simply returns “0” if the server is not listed and “1” if it is.
The template has 5 pre-made items and corresponding triggers. The items should be pretty self-explanatory. Example: check_dnsbl.sh[{HOST.DNS},zen.spamhaus.org]
You can change the existing DNSBL servers in the template or add your own, although the ones already added should cover most users quite well.
“{HOST.DNS}” is a macro that uses the DNS name you have specified for your hosts on their interfaces. The script requires the use of DNS names for it to function, however the script and template can be modified to use IP addresses instead. I wouldn’t recommended this though, since not using hostnames is bad practice anyway.
The default DNSBL’s used are:
b.barracudacentral.org – A free DNSBL of IP addresses known to send spam
bl.spamcop.net – The SCBL is a fast and automatic list of sites sending reported mail, fueled by a number of sources, including automated reports and SpamCop user submissions.
cbl.abuseat.
org – The CBL only lists IPs exhibiting characteristics which are specific to open proxies of various sorts (HTTP, socks, AnalogX, wingate, Bagle call-back proxies etc) and dedicated Spam BOTs (such as Cutwail, Rustock, Lethic, Kelihos etc) which have been abused to send spam, worms/viruses that do their own direct mail transmission, or some types of trojan-horse or “stealth” spamware, dictionary mail harvesters etc.
dnsbl.sorbs.net – The SORBS (Spam and Open Relay Blocking System) provides free access to its DNS-based Block List (DNSBL) to effectively block email from more than 12 million host servers known to disseminate spam, phishing attacks and other forms of malicious email.
zen.spamhaus.org – ZEN is the combination of all Spamhaus IP-based DNSBL’s into one single powerful and comprehensive blocklist to make querying faster and simpler. It contains the SBL, SBLCSS, XBL and PBL blocklists.
You can find additional ones at: www.dnsbl.info
DNSBL queries explained
As an example, when a mail server receives a connection from a client, and wishes to check that client against a DNSBL (let’s say, dnsbl.example.net), it does more or less the following:
Take the client’s IP address—say, 192.168.54.32—and reverse the order of octets, yielding 32.54.168.192. Append the DNSBL’s domain name: 32.54.168.192.dnsbl.example.net. Look up this name in the DNS as a domain name (“A” record). This will return either an address, indicating that the client is listed; or an “NXDOMAIN” (“No such domain”) code, indicating that the client is not.
Optionally, if the client is listed, look up the name as a text record (“TXT” record). Most DNSBL’s publish information about why a client is listed as TXT records.
Looking up an address in a DNSBL is similar to looking it up in reverse-DNS. The differences are that a DNSBL lookup uses the “A” rather than “PTR” record type, and uses a forward domain (such as dnsbl.example.net above) rather than the special reverse domain in-addr.arpa.
Zabbix IP Blacklist Template installation
- Download the template and script.
- Copy “check_dnsbl.
sh” to your Zabbix Servers and Proxies and place it in “/usr/local/share/zabbix/externalscripts” *
* Check your server and proxy configuration file for the correct folder, look for the tag “ExternalScripts” - Make the script executable: chmod +x /usr/local/share/zabbix/externalscripts/check_dnsbl.sh
- Create the following value map (Administration -> General -> Value mapping: Create value map)
Name: IP Blacklist 0 -> Not listed1 -> Listed
- Import the template and assign it to your host(s).
Host name should be the domain you want to check. Agent interface must have “DNS name” set and “Connect to” must be set to “DNS“.
If script does not return any data try to execute it manually under account of Zabbix server’s daemon. For example:
$ sudo -u zabbix ./check_dnsbl.sh example.com b.barracudacentral.org
Zabbix server will look in the directory defined as the location for external scripts (parameter ‘ExternalScripts’ in Zabbix server configuration file) and execute the command.
The command will be executed as the user Zabbix server runs as, so any access permissions or environment variables should be handled in a wrapper script, if necessary, and permissions on the command should allow that user to execute it.
Only commands in the specified directory are available for execution.
Script: check_dnsbl.sh
| 12345678910111213141516171819202122232425 | #!/bin/bashif [[ $# -ne 2 ]]; thenecho “Usage: ./${0##*/} “exit 1fi# Retrieves A record for hostname ($1)HOSTLOOKUP=`host -t a $1`# IP address validity checkif [[ ! ${HOSTLOOKUP##*[[:space:]]} =~ ^[0-9]{1,3}.[0-9]{1,3}.[0-9]{1,3}.[0-9]{1,3}$ ]]; thenecho “Could not resolve a valid IP for $1″exit 1fi# Converts resolved IP into reverse IPREVIP=`sed -r 's/([0-9]+).([0-9]+).([0-9]+).([0-9]+)/4.3.2.1/' |
Источник: https://itgala.xyz/spamlists-monitoring-in-zabbix/
Zabbix: мониторинг лога, автоматическое восстановление триггера
Есть триггер, который по timestamp мониторит лог-файл. Как только в логе появляется соответствующая запись, триггер срабатывает.
Вот пример выражения такого триггера, который срабатывает на запись «FAILED»:
{myserver_name.com:log[“/var/log/my.log”,”FAILED”,”UTF-8″,”10″,skip].logsource(FAILED)}=0
И всё хорошо, но в Item для данного триггера всё время будет появляться только запись «FAILED» и более ничего, а значит триггер никак не вернётся самостоятельно из статуса «PROBLEM» в статус «OK».
Вариант 1.
Решение я подсмотрел на форуме zabbix. Для того, чтобы триггер возвращался в состояние «ОК», надо для его срабатывания добавить ещё одно условие, которые в любом случае будет менять свой статус. Или наоборот не будет менять свой статус. В данном случае можно за основу восстановления триггера взять промежуток времени, за который Item не получает новых данных. Например:
{myserver_name.com:log[“/var/log/my.log”,”FAILED”,”UTF-8″,”10″,skip].nodata(60)}1
Это условие, при котором триггер сработает, если будут получены новые данные за последние 60 секунд. Получается такое общее выражение для срабатывания триггера:
{myserver_name.com:log[“/var/log/my.log”,”FAILED”,”UTF-8″,”10″,skip].logsource(FAILED)}=0 and {myserver_name.com:log[“/var/log/my.log”,”FAILED”,”UTF-8″,”10″,skip].nodata(60)}1
Работает оно так. В Item приходит сообщение из лога «FAILED» и первое условие триггера выполнено. Триггер смотрит на второе условие и оно тоже выполнено, т.к. за последние 60 секунд Item изменил своё значение (nodata=0). Если через 60 секунд новых данных из лога не поступило, то второе условие триггера не будет будет выполнено (nodata=1) и триггер перейдёт сразу в статус «ОК».
Время в 60 секунд было взято произвольно и для каждого случая подбирается своё. Я брал рабочее значение 86400 секунд (сутки). Раз в сутки проверяется файл и если новых значений туда не поступило, то проблема более не актуальна.
Вариант 2.
Ещё один рабочий вариант с использованием двух Item. Смысл тот же, но используются два лог-файла. Из первого я получаю сообщение «FAILED» — первое условие. А из второго — кол-во этих сообщений.
{myserver_name.com:log[“/var/log/my.log”,”FAILED”,”UTF-8″,”10″,skip].logsource(FAILED)}=0 and {myserver_name.com:vfs.file.contents[/var/log/my.log].last(86400s)}>1
Это вариант удобнее тем, можно варьировать чувствительность триггера к кол-ву ошибок. В примере, если кол-во ошибок будет равно единицы, но при этом в лог-файле с ошибками записи «FAILED» нет, то это считается не критичным и триггер не сработает.
*Вариант-2 в рабочем исполнении используется вместо с скриптом bash, поэтому может выглядеть немного нелогичным.
Например, можно подумать, зачем смотреть сообщение «FAILED», когда при его наличии кол-во ошибок и так будет известно. Тут не совсем так, т.к.
скрипт парсит совсем другой лог и смотрит только конкретные строки с сообщением «FAILED». При этом могут быть другие ошибки «FAILED» и скрипт посчитает только их кол-во.
Использованный материал.
https://www.zabbix.com/forum/showthread.php?t=39146
Источник: https://vot-tak-vot.tk/?p=201
Monitoring Postfix and saving statistics with Zabbix on CentOS6
This post is about monitoring a postfix server with zabbix, and at the same time saving the postfix mail statistics to zabbix. I assume that you already have a zabbix server running either in another server, or in the same server as the mail server.
We will need pflogsumm and logtail utilities for parsing and analysing postfix mail log, and those utilities are not available in centos6 base repository. We will need to enable EPEL repository by downloading and installing the latest EPEL repository from here:
root@server:~# wget http://mirrors.ispros.com.bd/fedora-epel/6/i386/epel-release-6-8.noarch.rpm
root@server:~# rpm -Uvh epel-release-6-8.noarch.rpm
Now we will install pflogsumm and logtail:
root@server:~# yum install logcheck postfix-perl-scripts
Next, you will need to install zabbix and zabbix-agent on your mail server.
root@server:~# rpm -Uvh http://repo.zabbix.com/zabbix/2.2/rhel/6/x86_64/zabbix-2.2.3-1.el6.x86_64.rpm
root@server:~# rpm -Uvh http://repo.zabbix.com/zabbix/2.2/rhel/6/x86_64/zabbix-agent-2.2.3-1.el6.x86_64.rpm
Now edit /etc/zabbix/zabbix_agentd.conf and put the following content at the end:
EnableRemoteCommands=1
UserParameter=postfix.pfmailq,mailq | grep -v “Mail queue is empty” | grep -c '^[0-9A-Z]'
UserParameter=postfix[*],/usr/local/bin/postfix-zabbix-stats.bash $1
Server=192.168.40.50
192.168.40.50 is your zabbix server IP, adjust it according to your actual zabbix server IP
Now put the following content in /usr/local/bin/postfix-zabbix-stats.bash and make it executable with chmod +x /usr/local/bin/postfix-zabbix-stats.bash:
#!/bin/bash MAILLOG=/var/log/maillog
PFOFFSETFILE=/tmp/zabbix-postfix-offset.dat
PFSTATSFILE=/tmp/postfix_statsfile.dat
TEMPFILE=$(mktemp)
PFLOGSUMM=/usr/sbin/pflogsumm
LOGTAIL=/usr/sbin/logtail PFVALS=( 'received' 'delivered' 'forwarded' 'deferred' 'bounced' 'rejected' 'held' 'discarded' 'reject_warnings' 'bytes_received' 'bytes_delivered' ) [ ! -e “${PFSTATSFILE}” ] && touch “${PFSTATSFILE}” && chown zabbix:zabbix “${PFSTATSFILE}” printvalues() { key=$1 pfkey=$(echo “$1” | tr '_' ' ') value=$(grep -m 1 “${pfkey}” $TEMPFILE | awk '{print $1}' | awk '/k|m/{p = /k/?1:2}{printf “%d
“, int($1) * 1024 ^ p}') old_value=$(grep -e “^${key};” “${PFSTATSFILE}” | cut -d “;” -f2) if [ -n “${old_value}” ]; then sed -i -e “s/^${key};${old_value}/${key};$((${old_value}+${value}))/” “${PFSTATSFILE}”
# sed -i -e “s/^${key};${old_value}/${key};$(((${old_value})+(${value})))/” “${PFSTATSFILE}” else echo “${key};${value}” >> “${PFSTATSFILE}” fi
} if [ -n “$1” ]; then key=$(echo ${PFVALS[@]} | grep -wo $1) if [ -n “${key}” ]; then value=$(grep -e “^${key};” “${PFSTATSFILE}” | cut -d “;” -f2) echo “${value}” else rm “${TEMPFILE}” exit 2 fi
else “${LOGTAIL}” -f”${MAILLOG}” -o”${PFOFFSETFILE}” | “${PFLOGSUMM}” -h 0 -u 0 –no_bounce_detail –no_deferral_detail –no_reject_detail –no_no_msg_size –no_smtpd_warnings > “${TEMPFILE}” for i in “${PFVALS[@]}”; do printvalues “$i” done
fi rm “${TEMPFILE}”
Make a cronjob:
*/10 * * * * /usr/local/bin/postfix-zabbix-stats.bash
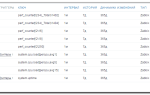
Import the following template in your “zabbix server”. It will show up in the list of templates as “Template App Postfix”. Add your postfix server as a monitored host in zabbix server, then associate the template with that host:
2.0 2014-02-03T14:56:13Z Templates Template App Postfix Template App Postfix Templates Postfix Postfix Bounced 0 0 postfix[bounced] 600 30 365 0 3 mails 2 0 0 0 1 0 0 0 Postfix Postfix Bytes Delivered 0 0 postfix[bytes_delivered] 600 30 365 0 3 B 2 0 0 0 1 0 0 0 Postfix Postfix Bytes Received 0 0 postfix[bytes_received] 600 30 365 0 3 B 2 0 0 0 1 0 0 0 Postfix Postfix Deferred 0 0 postfix[deferred] 600 30 365 0 3 mails 2 0 0 0 1 0 0 0 Postfix Postfix Delivered 0 0 postfix[delivered] 600 30 365 0 3 mails 2 0 0 0 1 0 0 0 Postfix Postfix Discarded 0 0 postfix[discarded] 600 30 365 0 3 mails 2 0 0 0 1 0 0 0 Postfix Postfix Forwarded 0 0 postfix[forwarded] 600 30 365 0 3 mails 2 0 0 0 1 0 0 0 Postfix Postfix Held 0 0 postfix[held] 600 30 365 0 3 mails 2 0 0 0 1 0 0 0 Postfix Postfix Mail Queue 0 0 postfix.pfmailq 300 30 365 0 3 mails 2 0 0 0 1 0 0 0 Postfix Postfix Received 0 0 postfix[received] 600 30 365 0 3 mails 2 0 0 0 1 0 0 0 Postfix Postfix Rejected 0 0 postfix[rejected] 600 30 365 0 3 mails 2 0 0 0 1 0 0 0 Postfix Postfix Reject Warnings 0 0 postfix[reject_warnings] 600 30 365 0 3 mails 2 0 0 0 1 0 0 0 Postfix Template SMTP Server Template SMTP Server Template SMTP Server Templates Port 25/SMTP is running 3 0 net.tcp.service[smtp] 60 90 365 0 3 0 0 0 0 1 0 0 0 {Template App Postfix:postfix[bounced].last(0)}>50 Postfix: Too many bounced mails on {HOST.NAME} 0 2 0 {Template App Postfix:postfix[deferred].last(0)}>50 Postfix: Too many deferred mails on {HOST.NAME} 0 4 0 {Template App Postfix:postfix[held].last(0)}>200 | {Template App Postfix:postfix.pfmailq.last(0)}>200 Postfix: Too many held mails on {HOST.NAME} 0 2 0 {Template App Postfix:postfix[rejected].last(0)}>20 | {Template App Postfix:postfix[reject_warnings].last(0)}>20 Postfix: Too many rejected mails on {HOST.NAME} 0 4 0 {Template SMTP Server:net.tcp.service[smtp].last(0)}#1 SMTP Service is down on {HOST.NAME} 0 4 0 Postfix Error Pie 900 200 0.0000 0.0000 0 0 3 1 1 0.0000 0.0000 0 0 0 0 0 0 C80000 0 2 0 Template App Postfix postfix[bounced] 1 0 00C800 0 2 0 Template App Postfix postfix[deferred] 2 0 0000C8 0 2 0 Template App Postfix postfix[discarded] 3 0 C800C8 0 2 0 Template App Postfix postfix[rejected] 4 0 00C8C8 0 2 0 Template App Postfix postfix[reject_warnings] Postfix Mails Scoreboard 900 300 0.0000 100.0000 0 0 0 1 0 0.0000 0.0000 0 0 0 0 0 0 009900 0 2 0 Template App Postfix postfix[bounced] 1 0 FF99FF 0 2 0 Template App Postfix postfix[reject_warnings] 2 0 AAAA00 0 2 0 Template App Postfix postfix.pfmailq 3 0 EE00EE 0 2 0 Template App Postfix postfix[discarded] 4 0 880088 0 2 0 Template App Postfix postfix[rejected] 5 0 0000CC 0 2 0 Template App Postfix postfix[received] 6 0 FF6666 0 2 0 Template App Postfix postfix[held] 7 0 FFFF33 0 2 0 Template App Postfix postfix[forwarded] 8 0 00EE00 0 2 0 Template App Postfix postfix[delivered] 9 0 EE0000 0 2 0 Template App Postfix postfix[deferred] Postfix Traffic 900 200 0.0000 100.0000 0 0 0 1 0 0.0000 0.0000 0 0 0 0 0 0 C80000 0 2 0 Template App Postfix postfix[bytes_received] 1 0 00C800 0 2 0 Template App Postfix postfix[bytes_delivered]
Your zabbix server should now have the statistics from your mail server, as well as triggers for unreachable mail server etc.
Источник: https://vimmaniac.com/blog/tutul/monitoring-postfix-and-saving-statistics-with-zabbix-on-centos6
Вышел Zabbix 3.0
Долгожданная версия открытой системы мониторинга Zabbix обещает нам целый ворох новых возможностей, вставая на путь визуального обновления.
Сегодня хочу поделиться с вами тем, что принес релиз, и чем можно начать пользоваться уже сегодня, скачав новую версию с сайта.
Мы также будем рады пригласить всех желающих на Zabbix Meetup в Москве, подробности о котором вы найдете в конце статьи.
Интерфейс
Первое, что бросается в глаза — это освежевший веб-интерфейс. Новый дизайн избавился от лишних, нагромождавших элементов, ушли различные ненужные рамки графиков и так далее.
Также интерфейс проработан с точки зрения удобства, например, теперь для любого узла сети или шаблона всегда можно посмотреть, как собственные макросы перекрываются с унаследованными. Доступно несколько оформлений, светлое и темное. Обязательно попробуйте темную сторону тему!
Про остальные изменения интерфейса можно почитать тут.
Шифрование
Теперь Zabbix поддерживает шифрование всех сообщений при необходимости — все общение между сервером, прокси и агентом может быть зашифровано и защищено от посторонних любопытных глаз.
Шифрование также предоставляет и аутентификацию — только при наличии доверенного сертификата или Pre-shared ключа компоненты смогут пообщаться с Zabbix.
Аутентификация при этом взаимная, то есть не только Zabbix Server проверяет сертификат агента, но и агент может быть настроен проверять сертификат сервера: кто его выпустил и можно ли им верить.
Шифрование при этом полностью опционально, и может быть настроено для каждого компонента отдельно ( то есть одни агенты и прокси могут использовать шифрование, а другие продолжать общаться в открытую как и ранее)
Если шифрование Вам не нужно или Вы к нему морально не готовы, то просто используйте Zabbix как и прежде (взяв в оборот другие новые возможности конечно! 🙂 ) При этом все компоненты 3.
0 будут поддерживать шифрование, и его можно будет постепенно включать для отдельных компонентов в удобном для себя темпе :).
И никаких новых портов — как и раньше 10050/10051 используются для всех видов коммуникаций в Zabbix.
Все подробности про шифрование в Zabbix здесь.
Предсказание и прогнозирование
Предвидеть проблему до того, как она произойдет? — Теперь да, в Zabbix 3.0. Говорят, что в 2016 на дисках все еще кончается место иногда. Zabbix может предвидеть такую ситуацию и спасти приложение от падения, предупредив всех заранее и дав время добавить или освободить место как раз до того, как начнутся проблемы.
Просто посмотрите пример, где Zabbix предсказывает, как быстро закончится место на /home, проанализировав исторические значения за последнее время.
Допустим, что нам нужно 10 часов, чтобы отреагировать и добавить или почистить место (как на скриншоте выше). И допустим, что 1 часа собранных данных о свободном месте достаточно, чтобы сделать корректный прогноз.
Реальная проблема для нас — когда место на разделе / (vfs.fs.size[/,free] ) полностью закончится, т.е. 0 байт.
Тогда Zabbix должен поднять аварию, когда прогноз на 10 часов вперед, основанный на собранных данных за предыдущий 1 час будет равен 0, или:
{host:vfs.fs.size[/,free].forecast(1h,,10h)}
Источник: http://www.pvsm.ru/open-source/112393